

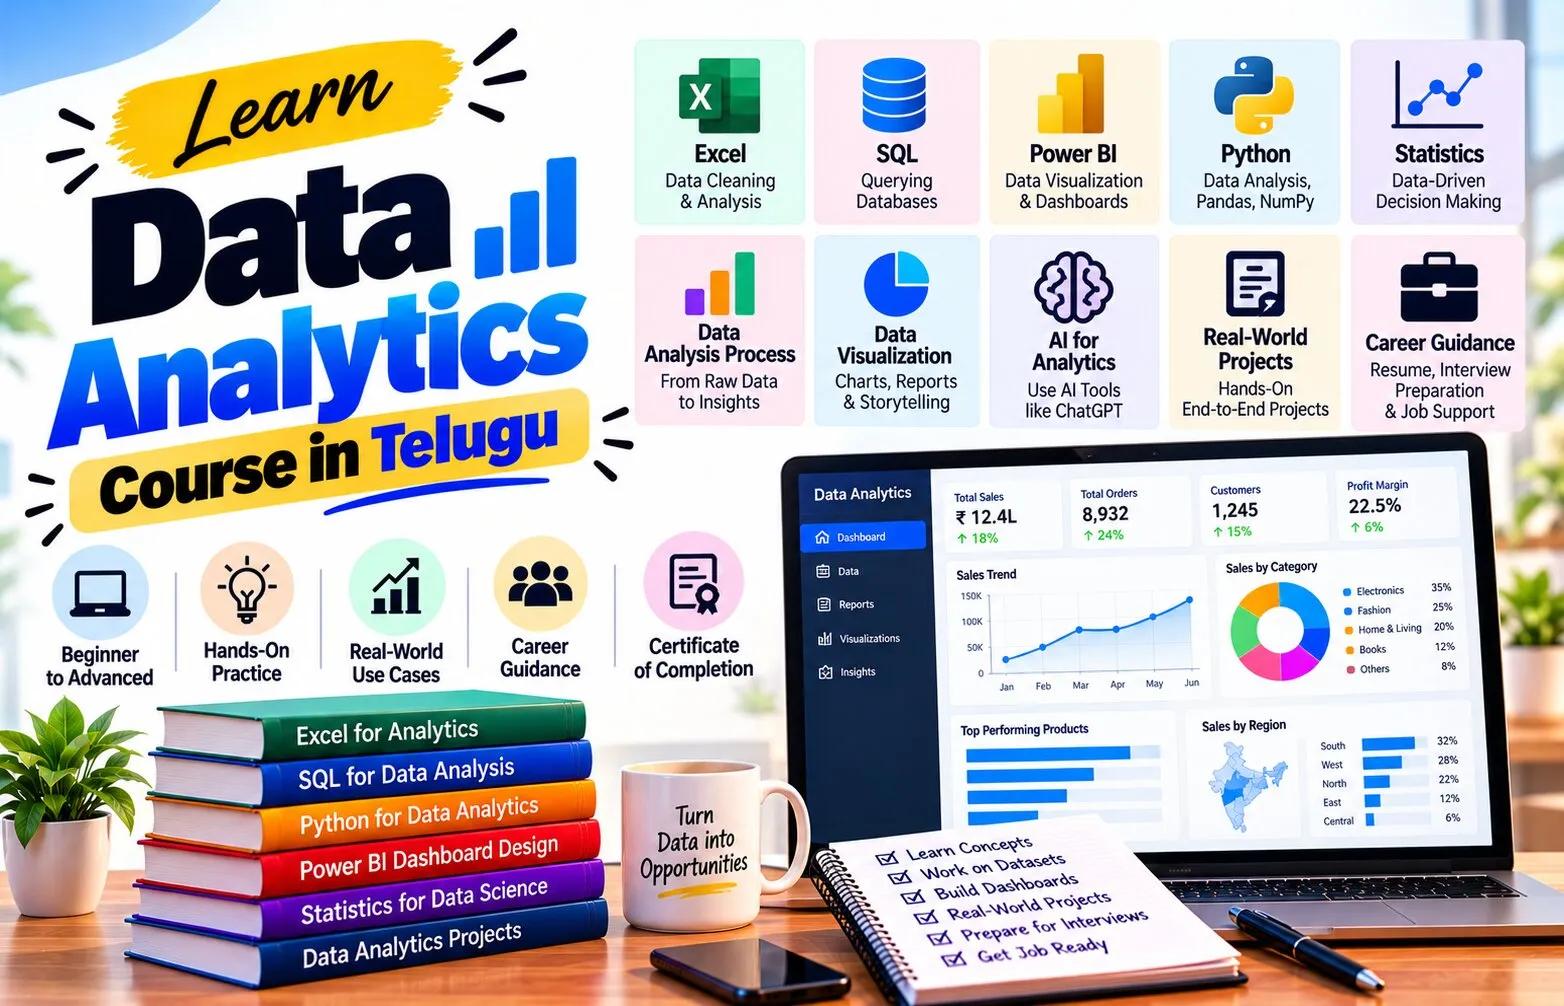
Introduction
Business teams need a simple way to understand whether performance is improving, declining, or staying on target. Key Performance Indicators, commonly called KPIs, help summarize important areas of performance into measurable values. However, a KPI is useful only when it is connected to a real business objective and reported consistently.
A Data Analytics Course in Telugu can help beginners learn how to define, calculate, track, and communicate KPIs through clear business reports. The focus should not be on displaying many numbers. The goal is to identify which metrics matter, compare them with meaningful benchmarks, and explain what the results mean.
What Is a KPI?
A KPI is a measurable indicator linked to a specific business goal.
Examples include:
Revenue Growth.
Conversion Rate.
Customer Retention Rate.
Order Fulfillment Time.
Qualified Lead Rate.
Return Rate.
Profit Margin.
A metric becomes a KPI when it is important enough to monitor against an objective or target.
For example, website visits may be useful, but if the business goal is qualified enquiries, visits alone may not be the key measure.
Start with the Business Objective
Every KPI should answer:
What are we trying to improve?
Suppose the objective is:
Increase profitable sales.
Useful KPIs may include:
Revenue.
Gross Profit.
Profit Margin.
Average Order Value.
Repeat Customer Rate.
Define the KPI Clearly
A KPI should have a precise definition.
For example:
Conversion Rate = Number of Conversions / Number of Eligible Visitors × 100
Qualified Lead Rate = Qualified Leads / Total Leads × 100
Definitions should clarify:
Numerator.
Denominator.
Time period.
Filters.
Exclusions.
Data source.
Without this, two teams may calculate the same KPI differently.
Choose the Right Time Period
KPIs can be tracked:
Daily.
Weekly.
Monthly.
Quarterly.
Yearly.
The right frequency depends on the decision.
A customer support team may need daily ticket volume.
A leadership team may review monthly profit margin.
Tracking a slow-moving KPI every hour creates noise without adding value.
Use Targets and Benchmarks
A KPI becomes easier to interpret when compared with something.
Useful references include:
Target.
Previous period.
Previous year.
Budget.
Team average.
Historical baseline.
For example:
Current conversion rate: 5.2%.
Target: 6%.
Previous month: 4.8%.
Now the user can see that performance improved but remains below target.
Track Variance
Variance explains the difference between actual and expected performance.
Example:
Sales Target: ₹20 lakh.
Actual Sales: ₹18 lakh.
Variance: -₹2 lakh.
Variance Percentage: -10%.
Avoid Too Many KPIs
One common reporting mistake is to display every available metric.
A dashboard with 25 headline numbers creates confusion.
Instead, group KPIs by priority.
For example:
Executive KPIs: Revenue, Profit, Customer Growth.
Operational KPIs: Orders, Delivery Time, Returns.
Marketing KPIs: Leads, Qualified Leads, Cost per Lead.
Each audience should see the information relevant to their decisions.
Leading and Lagging Indicators
Some KPIs describe results that already happened.
These are often called lagging indicators.
Examples:
Revenue.
Profit.
Customer churn.
Other indicators may signal what could influence future outcomes.
Examples:
Sales pipeline.
Demo bookings.
Website conversion.
Open support tickets.
These are often treated as leading indicators.
Using both can provide a more complete picture.
Design a KPI Dashboard
A KPI dashboard may contain:
Headline cards.
Trend charts.
Target comparison.
Variance.
Segment breakdown.
Filters.
Revenue.
Target achievement.
Monthly trend.
Top regions.
Top products.
Salesperson filter.
The layout should allow users to move from summary to detail.
Write Business-Friendly Titles
Instead of chart titles such as:
“Sum of Sales by Month”
use:
“Monthly Revenue Trend”
Instead of:
“Count of Lead_ID by Source”
use:
“Leads Generated by Channel”
Clear titles reduce the effort required to interpret the report.
Add Context to Changes
A KPI report should not only show current values.
It should explain meaningful changes.
Example:
“Qualified lead rate increased from 22% to 27% compared with last month.”
This is more useful than:
“Qualified lead rate: 27%.”
Where possible, add the segment or time period driving the change.
Separate Facts from Explanations
Suppose revenue fell 8%.
The data proves the decline.
It may not prove the reason.
A report can say:
“Revenue fell 8%, with the largest decline coming from Region B.”
That is data-supported.
It should not automatically say:
“Revenue fell because customers lost interest.”
That conclusion requires additional evidence.
Automate Repetitive Reporting
Business reports are often prepared weekly or monthly.
Instead of rebuilding the same calculations manually, analysts can create:
Reusable SQL queries.
Power Query transformations.
Power BI models.
Excel templates.
Scheduled refreshes.
Automation reduces repetitive work and can improve consistency.
However, the source data and calculations should still be validated regularly.
Build a Reporting Calendar
A reporting calendar helps teams know:
Which report is due.
How often it is refreshed.
Who owns the data.
Who reviews it.
Who receives it.
For example:
Daily: Sales operations report.
Weekly: Marketing funnel report.
Monthly: Executive KPI report.
Quarterly: Strategic performance review.
Use Alerts Carefully
Some systems can notify users when a KPI crosses a threshold.
Examples:
Return rate exceeds 8%.
Daily orders fall below 100.
Cost per lead exceeds a limit.
Alerts are useful when they trigger action.
Practical KPI Project
Use a fictional ecommerce dataset.
Create KPIs for:
Revenue.
Orders.
Average Order Value.
Return Rate.
Repeat Customer Rate.
Target Achievement.
Build a report with:
Five KPI cards.
Monthly trend.
Region comparison.
Target vs actual chart.
Product filter.
Then write three observations.
For every observation, state:
Current value.
Comparison.
Affected segment.
Possible next investigation.
Frequently Asked Questions
What is the difference between a metric and a KPI?
A metric measures something, while a KPI is a strategically important metric linked to a business objective.
How many KPIs should a dashboard contain?
There is no fixed number, but only the indicators needed for the audience’s main decisions should be emphasized.
Should KPIs always have targets?
Targets are useful when there is a defined performance expectation, but some monitoring metrics may instead use historical comparisons or benchmarks.
Which tools can be used for KPI reporting?
Excel, SQL, Power BI, and other business intelligence tools can all support KPI tracking.
Conclusion
A Data Analytics Course in Telugu can help learners understand KPI tracking as more than putting large numbers on a dashboard.
Useful KPIs begin with business objectives, clear definitions, reliable data, appropriate comparison periods, and meaningful targets. Reports should make it easy to see what changed, where the change occurred, and whether attention is required.
Strong business reporting separates measured facts from assumptions, avoids unnecessary metrics, and gives each audience the level of detail needed for decisions.
When KPIs are defined and reported consistently, analytics becomes a practical management tool rather than a collection of disconnected charts.